
With news organizations reporting nearly nothing save the coronavirus updates, most of the world is on hold waiting for indications of a timeline for the pandemic to subside. India, China, France, Italy, New Zealand, Poland, and the UK have implemented the world’s largest and most restrictive mass quarantines. Most of the entire population of the world is on some sort of a lockdown from their respective governments. While “lockdown” isn’t a technical term used by public-health officials, it can refer to anything from mandatory geographic quarantines to non-mandatory recommendations to stay at home, closures of certain types of businesses, or bans on events and gatherings – according to Lindsay Wiley, a health law professor at the Washington College of Law. As far as travel bans, according to Pew Research, 93% of the world’s population now lives in countries or territories that are the subject of travel restrictions. Now rumors are circulating that there will be Federally mandated bans imposed on travel WITHIN the U.S. The biggest questions now of course are: how long does this last, and how bad will the societal/economic damage be? Is there any light at the end of the tunnel?
As far as the first question of timing, basically when will the civic and economic restrictions begin to be lifted in various key countries, Deutsche Bank provides some estimates largely based on the experience of the lockdown and reopening in China’s Hubei province. Many are suspicious of the data coming from China; however, this is obviously ground zero for the entire pandemic and can provide a base model in order to make guestimates from. After all, the worst parts of pandemics of this nature are the unknowns.
As DB notes, one way to look at how other countries are converging on the experience in Hubei province, China is shown in the following chart. As the German bank explains, it uses “a three-day comparison in order to filter out the noise from sudden jumps and drops when figures were relatively small. We also start each time series at the point at which restrictions were introduced to attempt a closer comparison. We then show all the countries individually against the Hubei experience.”
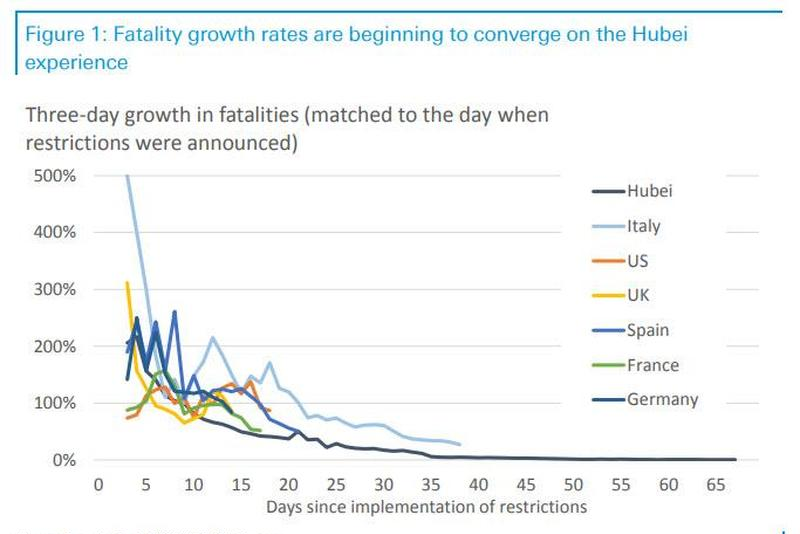
At first glance, it appears that the fatalities are falling faster in China than in other countries. However, according to DB that does not invalidate the comparison. First and foremost, China implemented restrictions earlier, quicker and in more Draconian fashion as the process of infection rolled out. As mentioned earlier, it is likely that China is fabricating some of this data as well as to appear in greater control of the outbreak than reality shows. In addition to this, the other countries compared in this chart have a greater proportion of their populations “at risk” – meaning primarily elderly. It must be noted that there can be a 14-day lag between restrictions and outcomes, and President Trump only urged social distancing on 16 March (while our time series starts at 12 March when New York implemented restrictions). In addition to that, different states in the U.S. have implemented restrictions at different times. Despite this, data is now indicating a convergence with China now that the lockdowns have been implemented in most states.
So, then we get to Deutsche Bank’s chart suggesting when restrictions may begin to ease…
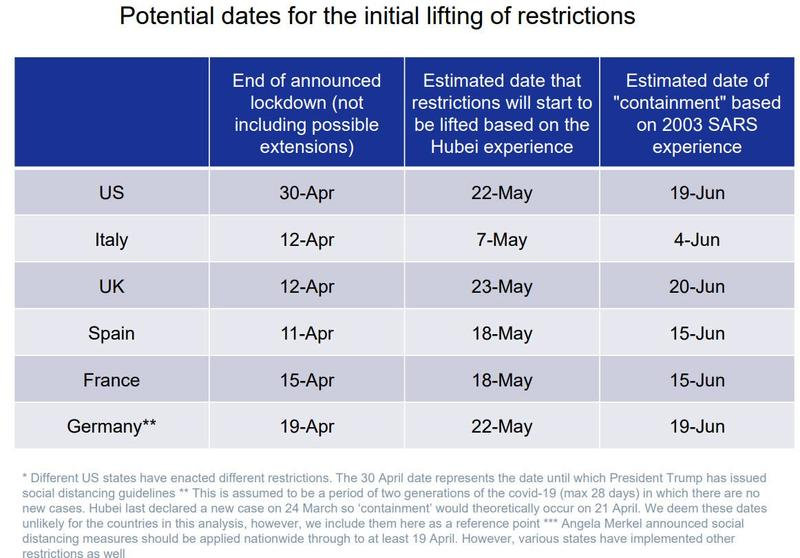
Of course, a chart like this is loaded with caveats and is at best an educated guess, but it does start to visually shape this pandemic into something intellectually manageable rather than just a giant gray area. The biggest caveat, of course is that this is assuming there isn’t a relapse into increased infection numbers like what we may be getting in China right now.
Governments across the globe are doing a balancing act between imposing restrictions according to scientifically backed need for societal preservation and the civil liberties of citizens. Finally, even if Deutsche Bank is right and the lockdowns are lifted sometime in late May/early June, any loosening of restrictions would have to be accompanied by a ramping up of testing, according to Martin Lohse, professor of pharmacology at the University of Würzburg.
When we try to answer the question about how much socio-economic damage will be done, we run into even more uncertainties. On one hand we see economic numbers falling off a cliff with businesses shuttered all across the country and unemployment applications skyrocketing. On the other hand, we see bazookas of stimulus both fiscally from the federal government and monetarily from the federal reserve. In the middle we see the interpretation of what is going on represented by the price of the asset markets between stocks, bonds, commodities and real estate. The S&P 500 at about 2500 represents essentially 100% confidence that structural corporate earnings power remains solid. That level is 21x trailing 10-year average S&P 500 earnings of $122/share – for a point of reference, in 2009 we bottomed at 10x trailing S&P earnings. Right now, with businesses shuttered we are skeptical that the market confidence is well founded. Even if restrictions were completely lifted by the end of April across the developed world, we expect “getting back to normal” to take several quarters as supply chains are damaged, loans aren’t being paid, employees aren’t being trained among many other issues. In addition to that, we expect some things to simply return to a “new normal” that isn’t what it was just this last January. A good example of that is commercial real estate. Many companies are realizing that they will not be requiring the degree of office space that they were paying for before the crisis. That will obviously not be good for some real estate companies, but there may be other unintended consequences that we cannot foresee right now. That is why many companies will simply remove “forward guidance” of their earnings altogether from the upcoming quarterly reports. Companies such as Visa, Twitter, Target, Domino’s Pizza and Deere have already withdrawn their guidance for 2020. That is on top of expectations that the S&P 500 earnings for the first quarter will be down 5.2% y-o-y according to FactSet. UBS reduced its whole-year S&P 500 2020 earnings estimate to $140 per share from $170 per share.
Of course, these markets are not perfect scales for the value of underlying assets – essentially the fed’s actions have removed the remnants of normal market price discovery. Eventually we do expect some normalcy to return to markets, in the meantime however we are planning on seeing some extreme volatility as no one knows how much damage is being done to the economy and the news good or bad can push markets quickly one way or the other.
Regards and good investing,
Greyson Geiler