by Greyson Geiler | June 7, 2021
In our weekly post, we do our best to make sense of the complex world of the financial markets we are all invested in between stocks, bonds, real estate and commodities. The financial world is immensely complex with billions of participants and moving parts including government regulators, producers, consumers and parasites. Regular readers are aware that we are very skeptical of the basic concept of the Federal Reserve. The idea that one entity or small group of people would have the power to set interest rate policy for the world’s reserve currency seems fundamentally dangerous. On top of that, the Federal Reserve has clearly extended past its “mandate” and attained a full stewardship roll of our economy, and by extension the entire world’s economy. One of the justifications of that discusses the FED having the capacity to guide the economy out of harm’s way when extreme events happen. Obviously, the last year and a half in the world has been an extreme event and the FED has undergone unprecedented actions in order to save the world economy.
Whether or not the SUNAMI of liquidity that the Fed conjured and released on the financial markets last spring was justifiable is a topic for a different discussion. It happened and here we are after an economic “recovery.”
The FED’s balance sheet has basically doubled in the last year and a half – rounding the edges, let’s say it went from $4 trillion before the “pandemic” to $8 trillion now. The FED has bought everything except the kitchen sink in the bond market (including some corporate junk bonds last spring.) The FED has essentially nationalized the bond market keeping interest rates artificially low and conjuring dollars to purchase assets in the open market. Whether or not our central bank should have intervened to the degree that it did – now the economy is clearly back on firmer footing and we don’t need emergency actions. However, the FED is currently buying $80 billion in treasuries and $40 trillion in Mortgage Backed Securities PER MONTH!! The stock market is red hot, the residential real estate market is WHITE HOT, people are really starting to worry about inflation, and yet the FED still has the peddle to the metal! Of course, one chart won’t tell the whole story, but here is an interesting indicator of how ridiculous the policies of our central bank are – Retail Sales…

Retail sales have remarkably consistent growth over the years. In this chart you can see 20 years of roughly 3% annualized growth – of course minus the 2008 crash. At the beginning of the “pandemic” of course retail sales cratered. Now however, we are screaming higher AT MORE THAN 15% ABOVE THE LONG-TERM TREND LINE AVERAGE!! Asset prices are launching as we mentioned above – and the FED still has emergency policies in place? This is madness…
Of course, the crazy policies of artificially low interest rates and buying treasury bonds have an obvious consequence of empowering Congress to go on a spending spree. Last fiscal year (2020) our government rang up more than a $3 trillion budget deficit. This year it will be north of $2 trillion and new spending plans out of our fearless leaders indicate the deficit next year will be approximately $2 trillion as well. Much of the Federal spending has gone to bail out reckless state governments and typical Washington DC pork barrel spending on projects for elected leaders’ cronies. Historically, governments around the world have at least had policies to attempt to limit budget deficits to 3% of their country’s GDP. We are staring at a budget deficit here of north of 10% of our GDP and there is really no end in sight. The total national debt has rocketed north of $28 trillion and now is a number so ambiguous that it seems irrelevant/trivial. The world has never seen financial recklessness on a scale such as this. We are not predicting when this will end – but we will say that doom does not seem imminent to us. Of course, things can change quickly in a system so leveraged and one must be cautious, so in the meantime don’t sell your gold J
Our simple question for the Federal Reserve policy makers is this: Where is the emergency that warrants your present monetary policies?
Regards and good investing,
Greyson Geiler

by Greyson Geiler | April 27, 2021
We are obviously in interesting times whether we are talking about political turmoil, weather extremes or the “pandemic” that doesn’t seem to be going away. If we are talking about national debt in financial terms we are in extreme times. Every day that goes by we have a new all-time record in sovereign debt to GDP both domestically and globally. Recently we have been seeing new highs in stock markets – we just came off all-time lows in long term interest rates. We talked last week about new lows in our Big Banks’ ratio of loans to deposits. We just got back to a new all-time high in the real estate market (U.S.) and a new all-time record with 58% of recent home sales having an accepted offer within two weeks (according to Redit.) Like we mentioned last week the distortions in financial markets – largely due to central bank and government manipulation – are not a good thing and this is going to end badly. However, we don’t see any reason to expect imminent disaster. That being said, the distortions from our fearless leaders are so acute that something completely unforeseen could create serious issues in financial markets.
We have noticed a new all-time record with regard to markets that we find interesting. Short interest is at a new all-time low and appears to be headed to zero:
Short interest is the indication of how many shares of stock are borrow and sold because an investor feels that the stock price will go down. If it does, the investor then buys back the number of shares they sold and give them back to whoever they were borrowed from. Of course, the short-seller is losing money if the stock price is going higher. Short selling has been a part of western-world for centuries now and is much more a part of market-making liquidity than the average investor realizes. This is a fundamental change in our stock markets and is definitely worth noting.
The obvious question is what sort of problems this decline in short interest could cause. One obvious problem has to do with liquidity. In the Covid-19 selloff of last March, many investors sold on the way down anticipating serious economic issues from the coming lockdowns. Many of the buyers of what nervous sellers were liquidating were short sellers covering their positions. This reduced volatility in an ALL TIME record high volatility time. No one knows how crazy March would have been last year if there weren’t short covering buyers to sell stock to. Even if you are a buy and hold strategy investor – no one wants to see double digit declines.
Going forward this is one more extreme that shows just how much our financial markets are changing. Market participants have largely given up on hedging risk – as that can cost portfolio performance if the market is going straight up. Many market timing strategies have sold when the sell signal hit, but have yet to get back into the market as there hasn’t been enough of a market pullback to trigger buy signals. The next time the market gives a pretty obvious buy signal – market timers should be careful.
Regards and good investing,
Greyson Geiler

by Greyson Geiler | April 19, 2021
Strange things are afoot at the Circle K…
We know that this is not a perfect time to reference a second rate 80s comedy movie – Bill and Ted’s Excellent Adventure – we are supposed to be serious when writing about the financial world- right? But things have gotten topsy-turvy in our central bank manipulated world and our situation has ended up somewhat – well, almost a little comical.
For decades in the financial media, strong economic numbers imply that bonds should be selling off (interest rates rising) as investors leave the safety of bonds for the higher returns of equities. Of course, everything needs to be taken with a grain of salt now that we have a Federal Reserve buying bonds every month to the tune of $100-120 billion. But even with this whole Covid lockdown, American interest rates never got negative like much of the rest of the developed world. Then in the last few months the longer-term interest rates in the U.S. firmed up significantly as the economy has proven to be quite resilient. Clearly much of the economic resilience is due to reckless fiscal “stimuli” from our fearless leaders and that will have to be paid for at some point. But much of the rest of the world has been pulling similar shenanigans from a monetary and fiscal stimulus perspective and some places (check Australia for example) are in way worse shape than we are.
So, imagine our surprise last week when shockingly firmer economic data than what was expected came out AND BOND PRICES ROCKETED HIGHER!
These data included notable upside surprises on the part of the Empire and Philly Feds, a 193K drop in initial jobless claims vs expectations of only a 44K decline and a strong beat in terms of headline retail sales which jumped 9.8% m/m in Mar vs. 5.8% anticipated. One would expect a selloff in bonds, yet the rally took the 10yr interest rate almost back down to 1.5% and the 30- year rate touched 2.2%.
Our best guess for the reasoning behind this is the bond market pricing in (selling off because of) expectations of more reckless fiscal “stimulus” from the swamp in Washington DC. If the economy shows remarkable strength, then bad government “stimulus” is less likely, so the bonds have a relief rally…
But another anomaly in the financial world is the weakness of bank loans at the Big Four. That may have more explanation for lower interest rates. The banks are having a relatively tough time finding people/businesses that want loans. So, the deposit side of banks is booming – stimulus checks being deposited. But the loans aren’t being originated on the other side. That is a very curious dichotomy considering the strong economic numbers that came out last week. Take a look at a long-term chart showing how weak loan demand is relative to the deposits on account.
JP Morgan reported that in Q1 its total deposits rose by a whopping 24% Y/Y and up 6% from Q4, to $2.278 trillion, while the total amount of loans issued by the bank was virtually flat sequentially at $1.011 trillion, and down 4% from a year ago. That is a crazy reality and things aren’t any better at the other big banks. An even more stunning divergence between total deposits and loans, emerges at Bank of America where deposits similarly hit a new all-time high of $1.88 trillion, even as the bank’s loans have continued to shrink at an alarming, deleveraging (and deflationary) pace and are now at $911 billion. Bank of America has had negative loan growth for the last twelve years!!
Here are the aggregate numbers on a chart for the Big 4 – JP Morgan, B of A, Citibank, and Wells Fargo:

What is obvious in this chart is that while loans and deposits moved hand in hand for years, starting with the collapse of Schemin’ Brothers, loan creation has been virtually non-existent (total loans are now at levels seen at the time of Schemin’s collapse) while deposits have risen to just about $10 trillion. There are now far more deposits than loans at American Banks, nearly twice as many. It has been these deposits that have gotten into the asset markets rather than loans getting out to main street America – and it is accelerating.
So, what does all this mean? We believe that the banks will be forced to push loans as deposit growth is grinding to halt with the slowdown of QE. Loan growth can obviously be good for the economy – but the lack of that growth for the last decade with interest rates so crazy low has shown soft growth in the economy. Now banks will have to make loan terms very attractive for businesses and end consumers…
Will that bring about the inflation that much of the financial world is preparing for? Maybe – but only time will tell on that. What we do see is a continuation – an acceleration really – of some of the trends set in place by the 2008 meltdown. Asset prices continue up and interest rates remain in a downtrend and, as we have said many times – this certainly won’t end well, but it doesn’t look like doom is imminent. Of course, that can change quickly so stay tuned…
Regards and good investing,
Greyson Geiler
by Greyson Geiler | April 12, 2021
Earnings season begins this week, and the world markets are trying to balance the enthusiasm of a post-covid recovery and the reported data of lingering “pandemic.” In the week ending last Friday April 9, the numbers recorded by John Hopkins University showed a 4.45 million increase in cases globally, which compares with increases of 4.11m, 3.78m and 3.29m in the three weeks before that. This increase is noteworthy, yet shy of the December and January increases. Some countries have been hit particularly badly by the latest wave, with India seeing another record 152,879 cases on Saturday. Japan has also seen some sharp rises lately, Tokyo has raised the alert level and is implementing restrictive measures to limit the spread of the virus in front of the Summer Olympics.
Europe is reporting a welcome decline in virus numbers, the UK reported fewer than 2,000 cases yesterday for the first time since early September. Restrictions are now easing in England, with the reopening of non-essential retail and outdoor hospitality venues. Conversely however, parts of France are renewing school lockdowns, so there isn’t a uniformly rosy picture in Europe.
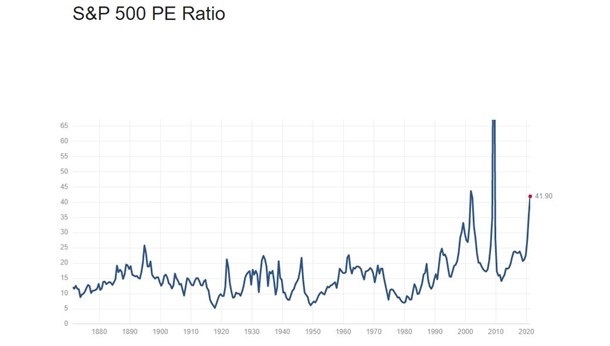
First quarter earnings season kicks into gear this week, with the highlights including a number of U.S. financials. The biggest names releasing this week include JPMorgan Chase, Wells Fargo, Goldman Sachs and Tesco on Wednesday. Then on Thursday we will hear from UnitedHealth Group, Bank of America, PepsiCo, Citigroup, Charles Schwab, BlackRock and Delta Air Lines. And on Friday, releases will include Morgan Stanley and BNY Mellon. The “beat the street” game should be in full force which means that reported expectations of earnings will be lower so that actual earnings numbers can impress market observers. The stock market has been rallying for more than a year in anticipation of a return to normalcy in the economy. The issue is the empirical reality that in historical terms the earnings of the S&P 500, for example, may not warrant the height of the market pricing. Although PE Ratio is an oversimplified estimate of what the market is worth, here is a look at that ratio historically:
That one data point is looking quite bubblesque – that doesn’t mean we need to run for the exits, but it certainly means that we need to see a continuation of accelerating earnings growth, or things could get nasty fast. Of course, artificially suppressed interest rates and reckless spending by Congress are bolstering these stock price numbers in the near term, but that is a horrible long-term strategy that will likely end badly – so stay tuned!
On the economic macro-data front, the highlight this week will be the CPI (Consumer Price Index) report on Tuesday. Many are bracing for sharp increases in inflation numbers in the weeks/months ahead. This comes against the backdrop of a very strong jobs report for March and an ISM services reading that was the highest since the series began back in 1997. Deutsche Bank economists expect a blistering +0.48% month-on-month increase in the headline CPI, along with some strong releases elsewhere as well, with a projected +8.9% increase in retail sales for March thanks to the latest round of stimulus checks and payback from bad weather in February. Bank of America’s economists expect an even more blowout retail sales print, one in the 11%+ range.
On Friday China will release their first-quarter GDP number. Deutsche Bank economists expect a surge in growth to +21.3% year-on-year, up from +6.5% in Q4 as the comparison will now be against the quarter when the “pandemic” first impacted the Chinese economic numbers.
Also worthy of note are the treasury auctions coming up this week. Today the treasury will auction $58BN in 3-year notes, followed by $38BN 10-year notes. Tomorrow there will be a $24billion auction of 30-year bonds. As we mentioned in this post last week, the long end of the bond curve is at an interesting crossroads. It will be interesting to see how these auctions are received by the market – so definitely put this on the radar for an indicator of where long-term interest rates are heading.
This is a very action-packed week and next week we will be hearing from central bankers around the world. Their comments are often packaged in fancy terminology without legitimate substance, but the whole financial world will be watching – so sometimes there are reactions worth noting!
Regards and good investing,
Greyson Geiler
by Greyson Geiler | April 5, 2021
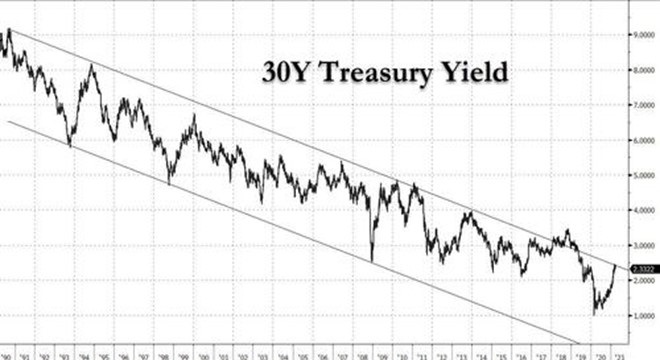
The most important price in the entire world is the price of money as defined by U.S. interest rates. We continually talk about the manipulation of the world’s asset markets by central banks and ground zero of that market manipulation is what our Federal Reserve does with interest rates. The Fed’s “mandates” from Congress are ambiguous enough “stable prices” “moderate long term interest rates” “maximum employment” that they have become somewhat of a de facto central-planning coordinator that the Soviets might envy. Historically, short term interest rates were directly under their control, however they are manipulating long term interest rates more and more with their open market purchases of longer-term bonds pressing the prices up and the interest rates down. The trend of long-term interest rates has been down for decades and now the Fed has been accelerating this trend purchasing mountains of 30-year bonds as well as other durations. The Fed’s balance sheet has rocketed to almost $8 trillion dollars as it continues to manipulate long term interest rates lower.
Take a look at the last 30 years in interest rates…
Now Goldman Sachs is labeling this the most interesting chart in finance as the long-term treasury yields push up against the decades-long downtrend. The obvious question is – what happens if interest rates push up higher through this descending trading range? Lots of assets are financed by these long-term rates and of course it is not limited to housing, when we talk about 30-year rates, housing and fixed-rate mortgages is often where the discussion goes.
The recent rally in the price of homes/residential real estate is reminiscent of the boom previous to the 2008 bust. Very often the culprit of the 2008 meltdown – or at least the catalyst of – was the sub-prime mortgage. At the time, anyone paying attention understood that the rally in home prices wasn’t authentic – driven of consistent demand over supply – but instead it was a debt fueled frenzy. The acronym label “NINJA Loan” came about in 2006 referring to the No Income, No Job and no Asset having mortgage borrowers that the banking system originated a loan for anyway. Although anecdotally we are beginning to hear of similar financing from the behind the scenes, to this point in the real estate boom we were more concerned about the manipulation by government decree that was slowing/halting defaults that may have kept a lid on the market if the marketplace had been allowed to take its natural course. (Of course the Fed is also buying some $40 billion per month of mortgaged backed bonds this time around which is larger than the last cycle Freddie/Fannie artificial financing.)
But now, our government is worried about the situation a few months from now when some of the default moratoriums expire in September. The Consumer Financial Protection Bureau (CFPB) warned mortgage firms last Thursday “to take all necessary steps now to prevent a wave of avoidable foreclosures this fall.” As of March 30, approximately 2.54 million homeowners remain in forbearance or about 4.8% of all mortgages, according to the latest data from Black Knight’s McDash Flash Forbearance Tracker. That math is pretty easy, because total mortgage debt in America is right at $10 trillion – so we are talking about almost HALF A TRILLION DOLLARS OF MORTGAGE DEBT IS CURRENTLY IN FORBEARANCE. We have no idea what the CFPB means regarding steps mortgage firms can take prior to September, but if forced to guess – we would say that people in forbearance will probably get more reprieve come the fall funded by U.S. taxpayer dollars. The halves vs halve not situation in this country continues to widen – government “stimulus” making it DRASTICALLY worse – and we would guess that this will not change. So, the Fed will continue pouring more easy credit on the “everything bubble” and we are guessing that the mortgage forbearance “crisis” coming up in a few months will get papered over by the Fed just like other monetary/economic dilemmas of the past few decades…
We continue to look for the cracks in the dam, and although we are concerned that the real estate market has gotten out of hand 2006-07 style, we don’t see the subprime mortgage-type obvious warning sign yet that could trigger a meltdown. The Fed is managing this situation knowing what happened last time – but they are not forward looking and when the catalyst comes that can send real estate or other asset prices into a tailspin, the Fed (and other central banks) will still be looking in the rear-view mirror. Obviously, that doesn’t end well – but for now the party is still going, so hang on!!
Regards and good investing,
Greyson Geiler