Velocity of Money

Velocity of Money

In this weekly post, we have repeatedly discussed our concerns about our Federal Reserve buying assets in the open market (mostly bonds) and keeping interest rates artificially low for years now. Historically low interest rates have empowered the Federal government to take on enormous amounts of debt (now totaling nearly $30 trillion) and spend money recklessly.  Now, with the worst of the Covid crisis clearly behind us, yet monetary and fiscal “stimulus” going full tilt (supposedly another $3 trillion “stimulus” waiting in the wings,) Americans are bracing for the strongest inflation in a decade as the new “stimulus” promises to accelerate the U.S. economic rebound. Consumers’ median year-ahead inflation expectations rose to 3.1% in February from 3%, according to the Federal Reserve. Expectations for inflation three years from now held steady at 3%, according to the Fed.

Intuitively this money circus will not end well, but the discussion of the looming inflation because of the financial profligacy of the Fed and Congress seems to be overblown right now (many are discussing drastically higher inflation numbers than are listed above.) We are the first to discuss potential consequences of financial leaders who lack any modicum of discipline. However today, we want to introduce to you another variable in this complex monetary equation that will at least shed some light on the recent performance of our economy where the “pending rocket launch” of inflation has only reared its ugly head in a few industries.  This is leaving a lot of pundits scratching their heads and wondering when this imminent total paper-money meltdown occurs. We can’t answer that question, but we can continually add variables and factors involved in the situation to help us find cracks in the dam as they occur…

Enter the Velocity of Money – also loosely defined as the money multiplier. This is a fairly simple economic concept, yet we find it very rarely discussed – especially by those telling you about an imminent doom in our monetary system.  Here is the definition according to Investopedia:

The velocity of money is a measurement of the rate at which money is exchanged in an economy. It is the number of times that money moves from one entity to another. It also refers to how much a unit of currency is used in a given period of time. Simply put, it’s the rate at which consumers and businesses in an economy collectively spend money. The velocity of money is usually measured as a ratio of gross domestic product (GDP) to a country’s M1 or M2 money supply.

To further illustrate this concept, imagine that you borrow $30,000 for a new car. That money is conjured into existence by our banking system. You spend it on the car. The car company uses that money to pay its material costs, employees, other operational costs, taxes, etc.  The car company’s employees then take some of that money and go out to dinner. The waiter from the restaurant takes some of the tip money and goes to buy gas for his car to get him home. The gas station then… and so on and so forth…

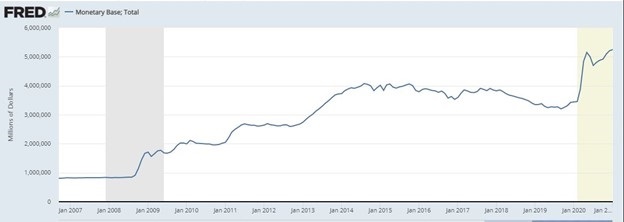
How many times the same dollars are spent is a very important factor in how quickly inflation takes off. Well, take a look at the history of the velocity of M1 (very liquid, usable monies) historically…

Of course, the velocity of money is not the only variable in what drives inflation. As an example, the government reported inflation was DRASTICALLY higher in the late seventies and early eighties than in the 2007-08 period. Yet from this chart the multiplier was much higher in the same 2007-08 time frame than the seventies/eighties. Obviously, many other factors are involved…

However, the point of this discussion is to show you how the velocity of money has completely fallen apart. Of course, the Covid has a lot to do with this, but even before covid hit these numbers were down near 50-year lows. Now with the “stimulus,” we will see how these numbers react. This is very interesting regardless of the Covid considering the lack of discipline on the part of monetary/fiscal authorities. The money isn’t changing hands very many times. Has the methodology for calculating these numbers changed? Has the more widespread use of credit put a damper on the multiplier over the years? One thing that these numbers do seem to imply is that the percentage of money being created is going into hoarding (asset prices going higher for the uber-rich.) Also, some of the money may be sent overseas for the purchase of foreign made goods.  That wouldn’t make these velocity numbers – but still should be considered because down the road some of that money may come back to the U.S. chasing the same goods, services and asset prices we are trying to buy. That would reignite inflation.

Inflation is off the charts on asset prices (have you tried to buy a house lately?)  However, in everyday purchases, runaway inflation just hasn’t hit to the degree that you would expect considering the trillions of $$ being poured on the game. We are not suggesting that inflation isn’t coming down the road, however we are looking for reasons that it hasn’t hit already. Looking at the velocity of money implies that a lot of the “stimulus” is just being gathered up right now rather than spent in the open economy.  There is slack in the system from Covid that may be getting filled up very quickly by government actions. We will keep searching for the cracks in the dam, but right now the imminent doom of the value of our currency seems overblown to us. Stay tuned…

Regards and good investing,

Greyson Geiler

Inflation Fears

Inflation Fears

The speed with which the U.S. economy has recovered after the Covid-19 shock has surprised most observers.  According to Morgan Stanley estimates, the U.S. will reach pre-crisis output levels by the end of the current quarter. They further expect the economy to outpace the path that it was projected to follow before the recession hit – which would be the first time since the 1990s that the GDP rose above its pre-recession projected path in post-recession reality. Morgan Stanley’s chief U.S. economist Ellen Zentner, is forecasting growth of 7.3%Y in 2021 and 4.7%Y in 2022, almost 2 percentage points above consensus this year and 1 percentage point next year. That is quite a wide margin and of course we look to find reasons for such a gap.

That brings us to the monetary and fiscal policies that our fearless leaders in Washington have embarked upon. The fiscal policies from Congress have totaled staggering sums of trillions of dollars that have now outpaced the income lost during the recession. As the economy reopens, the labor market is poised for a rebound which implies consumption growth in 2021 supported by wage income and transfer payments. Considering this, many economists are predicting consumption demands to stretch supply in coming months and spur inflation. The Federal Reserve has set its arbitrary 2% inflation target (which we have repeatedly declared erroneous) and even implied that they may tolerate inflation running hotter than 2% as sort of a make-up for weaker inflation numbers due to the virus scare.

Of course, as always, we question the Fed’s capacity to manage inflation to any modicum of precision should the genie pop out of the bottle. The U.S. debt numbers are skyrocketing on most every measuring scale (save personal credit card debt which is good news.) Should longer term interest rates continue higher we will have a problem on our hands. Asset prices as defined primarily by bonds and stocks are at very high numbers. The S&P 500 is trading at 22 times forward earnings, which is in the 99th percentile since 1976, according to Goldman Sachs, suggesting that the valuations could be a threat particularly in a rising-rate environment. However, comparing the S&P 500 dividend yield with the 10-year yield shows valuations only in a midrange – around the 42nd percentile. So maybe stocks are not so crazy high unless interest rates continue higher. Two weeks ago, when we wrote about this the 10-year Treasury yield had just pierced the 1.5% mark for the first time in more than a year. We mentioned then that a mutual fund manager we know had set the danger mark for stock prices at 3% on the 10-year Treasury yield. At the time of this writing that yield is 1.62% – still a long way from 3%.  We are keeping this on our radar, though as north of 2% would start to concern us. There is simply too much debt out there to sustain significantly higher service payments without significantly higher inflation.

But back to concerns about said inflation…The U.S. Bureau of Labor Statistics put out February inflation statistics last week. Some commentators complained about the gorilla math (BLS literally made some of the numbers up this month) the government uses including “hedonic adjustments” which are subjective calculations of higher utility. For example, your car may cost a lot more, but it has better gadgets and more functionality, so it is worth more. Right now, the rate of inflation is still shockingly low. Certain things, housing for example, have rocketed higher but the progress of technology has at least been a factor in keeping inflation at by in a number of different industries and consumer verticals. That is good news for at least the near term. At the end of the day, the “statistics” may say one thing, but most people recognize that there will only be so many times that the government can hand out $1.9 trillion dollars of “stimulus” and expect the value of those dollars to maintain their purchasing power. Wherever the breaking point is, our intuition is that our spendthrift crew in D.C. will eventually find that point. There is no perfect indicator of when/where the value of paper money will start breaking down. The chart of the growth of our “monetary base” is just one general indicator – it has launched higher and is now some 5 X of what it was before the last recession:

So, the amount of money in our system is obviously rocketing higher. We also believe there is a psychological component to managing confidence in a fiat currency – a component in which we believe our leadership is failing. In the meantime, if you listened to us late last year when we mentioned crypto-currencies https://andorracapital.com/u-s-dollar-weakness/  it is not yet time to sell them – and as we frequently write in this post, don’t sell your gold.

Regards and good investing,

Greyson Geiler

Interest Rates

Interest Rates

The Treasury yield curve has steepened significantly in the last couple weeks, as bond investors sold because of fears of higher inflation in the future. The Federal Reserve continues to pump an excess of “stimulus” into the financial markets via their asset purchases and by pinning short term interest rates essentially to zero. The Federal government is pouring more “stimulus” into the economy via Covid Relief bills. Together this is pushing the yield curve to the steepest (biggest difference between short-term and long-term interest rates) it has been for five years. Here is a look at the recent pricing of 30-year treasury bonds:

The new $1.9 trillion Covid Relief Bill that was passed in Congress has accelerated the sentiment in the bond market that inflation will be a concern in coming months/years therefore bond prices should be lower and interest rates should be higher. The bill is loaded with “pork barrel” spending for DC politicians’ cronies and the vast majority of the spending is not directly related to Covid -19 issues. Much of the funds are strategically allotted to where it would not even be spent in 2021.To call it a “Covid-Aid” package is such a misrepresentation reality that it is comical (but of course sad.)

Bond prices bounced back some on Friday (Feb 26th.) This is likely due to speculative money buying back treasury bonds on the thoughts that the $1.9 trillion Covid-Aid bill will not get passed by the Senate. We will be pleasantly surprised if 51 senators actually show some respect for the American taxpayers and bondholders and vote against it passing.

The stock market did sell off a bit last week with fears of interest rates going higher. Historically, high growth stocks (NASDAQ) sell off more in higher interest rate times and that is exactly what has happened this go around. Some big-name tech stocks like Facebook and Amazon pulled nearly 10% off of their recent highs. In a conversation with a mutual fund manager last week, we asked what interest rate would make them want to be more conservative in their stock portfolio allocations. They referenced the ten-year treasury rate and said that consensus in the mutual fund world is that a 3% rate on the ten year would be concerning.

Obviously, we are a long way from 3% right now, but we have it on our radar. The ten-year rate did however, breach 1.5% for the first time in more than a year before backing off to just over 1.4%. Mortgage interest rates bounced a little higher last week as well, so that may help cool off a red hot residential real estate market. Keep in mind, though that the Fed has committed to purchasing mortgage-backed securities which should keep a limit on mortgage rates going drastically higher. Hopefully if interest rates continue higher it will be representative of a stronger economy rather than just fear that our leadership in DC continues to disappoint with financial profligacy.

Regards and good investing!

Greyson Geiler


More Regulation Needed?

More Regulation Needed?

The biggest news in the financial markets recently comes from an unusual situation in the stock of Gamestop. A week ago, this was a $40 stock, with the company losing well over $4 a share which is pretty typical in the retail world right now. But then then the stock price ran up to almost $500. How did this come to pass?

The stock was heavily shorted. Meaning speculative investors were expecting the share price to go down. In fact, there were more shares short-sold than were actually in the “float” – how that happens is a subject for a different post. But the point of the matter was that a rising stock price would mean a lot of hedge funds would be losing money sitting “short” the stock.

There are a lot of moving parts in this story, but the basic theme is that a band of small investors were the catalyst for the short covering rally that cost some Wall Street mainstays serious money – tens of billions of dollars in fact. Discussion of the particulars of this situation have evolved into a David vs. Goliath sort of story and many people feel a serious gratification from the fact that these rogue traders intentionally picked a fight with the big whales and won. We understand this mentality – regular readers of our post know that we are free market enthusiasts. Although there is some regulation necessary to ensure free markets, developed world financial markets clearly being “regulated” for the benefit of the big players rather than for the little players. This feeling was reinforced when trading of Gamestop was halted (supposedly initiated by regulators) for retail traders in order to give the well-connected hedge funds some time to manage the positions that they were losing buckets of money on. The irony of a company called “Robin Hood” becoming one of the mechanisms to lock small traders out of continuing to buy Gamestop and “stick it to” some big Wall Street funds is precious. We are waiting to hear how regulators will “fix the problem” as it seems to us that they have played an instrumental role in creating many of these problems. More regulation would cause more problems. Bad things happen in free markets – and this is a lesson that needs to be relearned by market participants periodically.

Success of the band of small investors (WallStreetBets) wasn’t limited to Gamestop. There have been enormous short covering rallies in a number of stocks and now the crew is turning their target to silver.  Historically, silver has been a monetary mechanism. It has represented money for millennia and has only recently been relegated to being an industrial and ornamental product. We believe that the estimation of the big bank manipulation of silver (and gold) prices are DRASTICALLY overreported. However, the delivery mechanism of the silver futures contract and the distribution system of the commodity in general are manipulated and woefully behind the times technologically so a forest fire is overdue. Silver is already up 20% in the last week…

We seriously doubt the possibility of silver rocketing higher to the degree that the Gamestop or other short covering rallies in stocks managed. First and foremost, this is a world-wide commodity and the “market cap” or basically the dollar worth of silver is some 30 times that of Gamestop before it rallied. Some of the silver producing mine stocks have rallied, but they didn’t have the buildup of short positions that originally motivated the WallStreetBets traders to congregate and buy. However, in a world of central bank profligacy that has descended into monetary madness, the conditions are right for a rally in one of the world’s original monetary instruments. How far that rally goes remains to be seen, but for now the trend in precious metals is higher. Regards and good investing.

Greyson Geiler

Welcome to 2021!

Welcome to 2021!

From all walks of life all around the world, most people were happy to close the books on 2020. The pandemic, international military saber rattling, wild asset market gyrations and a crazy U.S. presidential election are just the tip of the iceberg of the madness that 2020 brought. Reasonable people are hoping for a more benign 2021 and we are firmly in that camp!

The “everything rally” of the end of 2020 is showing asset markets that are quite disconnected from economic reality.  Even as major-city lockdowns continue globally, stocks and real estate in particular, are showing no signs of stopping their rally as the Federal Reserve – and other central banks world-wide- continue to support markets.  The Fed is accomplishing this by keeping interest rates artificially low and by conjuring new U.S. dollars and buying assets themselves. We have continually reported on this and here is a snapshot of the accumulating that the Fed has accomplished.

AGAIN! Is this telling us that the financial markets will never have to stand on their own again?  Will the Fed support markets into perpetuity?  These are obviously rhetorical questions, but it is completely counter-intuitive that all of these markets continue to get support when they are already at all-time highs.  An obvious example is the Fed purchasing of Mortgage-Backed Securities. Since March, the Fed has purchased nearly $1 trillion of these assets which allows mortgage originators to make their fees and sell the debt to the Fed.  This has kept mortgage rates at record lows which has fueled an amazing rally in residential real estate – and now the Fed has extending this program into the fall of 2021.  This is one example of the Fed building these markets into bubbles.

Intuitively this would be destructive for the value of the U.S. dollar. To a degree, it has been- take a look…


However, with all of the trade talk being so negative of the dollar’s value, it really isn’t panic time yet. The dollar was weaker three years ago and we are seeing financial headlines about the “meltdown” of the dollar. We are not seeing this meltdown and U.S. interest rates are much closer to normal than the bulk of the rest of the developed world. We will keep the dollar on the radar for sure, but to this point we don’t see huge problems. However, keep in mind this is simply relative to other currencies whose controlling central banks are pulling similar stunts to the Fed. The dollar’s value vs. hard assets is declining and that will absolutely be a concern down the road.

Regards and good investing,

Greyson Geiler